I recently noticed a chart in the Google Analytics software.
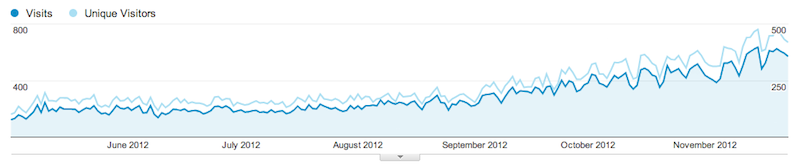
Here we see a comparison of two metrics: the blue line shows the number of visits (Visits), and the light-blue one shows the number of unique visitors (Unique Visitors). Take another look at the chart and answer the question: which is greater, visits or unique visitors? It may seem that the correct answer is “unique visitors,” but that answer is wrong. First, it’s illogical, because there are always fewer users than visits. Second, if we move the mouse over the chart lines, it shows us a tooltip:
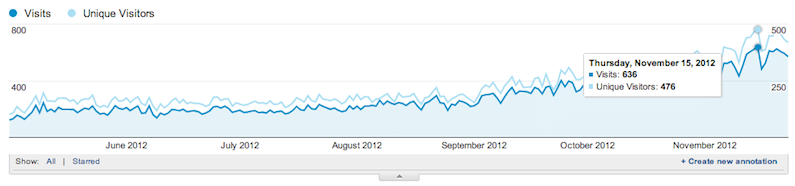
It turns out these two graphs are shown at different scales. One for visits, the other for users. And in fact there are more visits than unique visitors.
Since childhood, we’ve been used to the idea that in the Cartesian coordinate system, the higher a point is, the greater its absolute value. But apparently, in the U.S., children are taught somehow differently in school. The children grow up, become programmers, and make charts like this.